How Brain-to-Brain Synchrony Between Students and Teachers Relates to Learning Outcomes

Post by Elisa Guma

The takeaway

Synchrony of brain activity amongst students and between students and teachers predicts test performance following lecture-based learning. Furthermore, brain-to-brain synchrony is elevated during lecture segments associated with correctly answered questions.  

What's the science?

Social interactions between students and teachers have a profound impact on students’ learning and engagement. Students feel a greater sense of belonging and tend to have better outcomes in synchronous learning (i.e., where students and teacher interact in real-time) versus asynchronous learning (where students view prerecorded lectures). Interestingly, little is known about the brain mechanisms that support this type of learning. Synchronous brain activity across individuals referred to as brain-to-brain synchrony, may play a role. This week in the Association for Psychological Science, Davidesco and colleagues recorded brain activity from students and teachers in a classroom setting to determine whether brain-to-brain synchrony was associated with learning outcomes. 

How did they do it?

The authors recruited 31 healthy young adult males and females and two professional high school science teachers (one male and one female) to participate in the study. Students were broken up into 9 groups of 4 and attended four 7-minute teacher-led science lectures covering topics such as bipedalism, insulin, habits and niches, and lipids. To assess the degree of learning, students had to take an assessment comprising 10 multiple-choice questions at 3 different timepoints: (1) pretest: 1-week prior to the lectures, (2) immediate posttest: immediately following each 7-minute lecture, and (3) delayed posttest: one week following the lectures.

Electroencephalography (EEG) recordings were acquired from both students and teachers during each lecture and testing session to measure brain activity in real-time, with high temporal specificity. The data was preprocessed and filtered into three frequency bands: theta 3-7Hz), alpha (8-12Hz), and beta (13-20Hz). This was then averaged into three predefined brain regions of interest based on where the recording electrode was positioned on the head of each participant; this included the posterior, central, and frontal regions of the brain.

To quantify learning outcomes, the authors categorized a question as “learned” if it was answered incorrectly in the pretest, but correctly in either of the posttests, and “not learned” if the student’s answer was unchanged from pre- to posttest. The authors compared brain activity patterns 1) across pairs of students or 2) between students and the teacher to determine whether there was any brain-to-brain synchrony. Next, they evaluated whether the periods of brain-to-brain synchrony during lectures were associated with learning outcomes (pretest-to-posttest change). Finally, they evaluated whether brain-to-brain synchrony was higher during lecture segments that the students successfully learned compared to those they did not learn.

What did they find?

First, the authors found that test performance significantly improved from the pretest to the immediate posttest, as well as to the delayed posttest, but to a lesser extent. Next, they found that there was evidence for brain-to-brain synchrony based on recordings from the central electrodes and on alpha band frequency activity. Interestingly, this synchronous activity predicted both pretest-to-immediate-posttest learning as well as pretest-to-delayed-posttest learning. However, there was no effect when comparing activity in the two posttest sessions to each other. Additionally, alpha-band synchronous activity was higher during lecture segments corresponding to learned versus not learned questions.

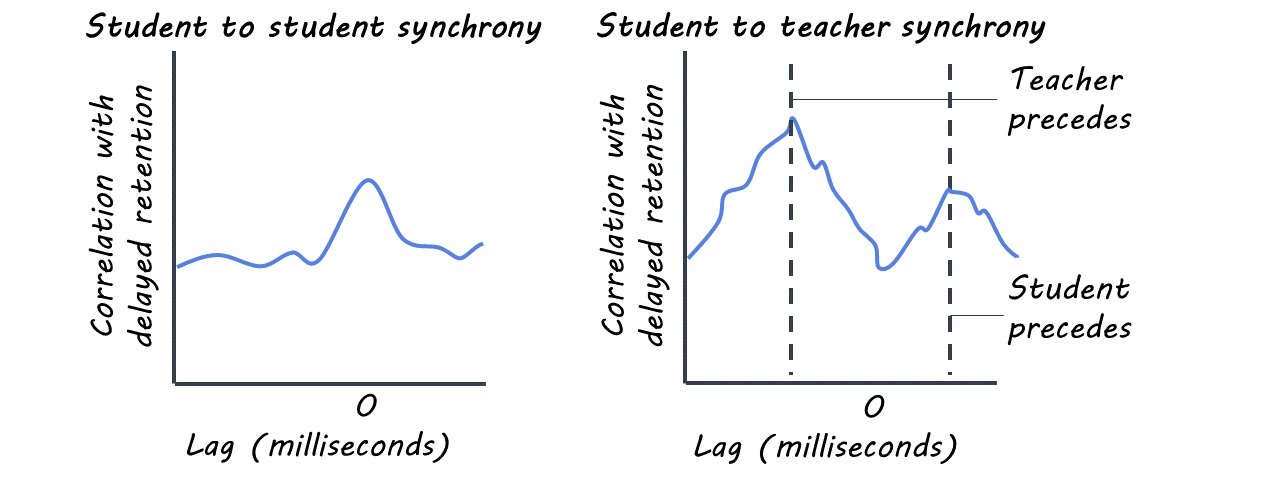
Next, the authors found that there was a temporal lag for brain-to-brain synchrony between students and teachers wherein the teacher’s brain activity patterns preceded the brain activity patterns of the students by 300ms. This is likely explained by the fact that the teacher served as the speaker and the students as the listeners. Furthermore, the student-to-teacher brain-to-brain synchrony significantly predicted pretest-to-delayed-posttest learning but not pretest-to-immediate-posttest learning.

What's the impact?

This study extends our understanding of how synchronous brain activity between students and between students and their teachers may be related to learning. Alpha rhythm activity in the central part of the brain is particularly relevant for this type of synchronicity. In future studies, it may be interesting to acquire data from other physiological signals such as heart rate, body motion, or eye movements to see how these might be related to EEG-measured brain activity to support learning. 

Access the original scientific publication here.

Encoding Numerical Information is as Easy as 1-2-3 for Infants

Post by Lincoln Tracy

The takeaway

Infants as young as three months old have ‘number sense’, meaning they can automatically encode the number of tones they hear or the number of objects they see.

What's the science?

The ability to discriminate numbers – independently of physical quantities such as size or density – is an important human behavior that is also observed in mammals, birds, and fish. However, it is unclear whether humans are born with an innate ‘number sense’, or whether this is a learned response. This week in Current Biology, Gennari and colleagues tested the existence of a genuine ‘number sense’ by examining the neural activity of three-month olds, measured by electroencephalography (EEG), in response to different stimuli containing numerical and non-numerical information. 

How did they do it?

The authors played a variety of auditory sequences that differed in length, rate, instrument, and pitch to 26 drowsy or sleeping three-month old infants while a high-density EEG system recorded their neural responses. The tones composing the sequences could be “short” (a 40ms tone with a 20ms gap between tones), “medium” (120ms with a 60ms gap), or “long” (360ms with a 180ms gap). For the analysis of the EEG recordings, the authors used multivariate pattern analysis to individuate any potential purely numerical neural code that was separate from the neural activity patterns reflecting other characteristics of the auditory stimuli such as tone rate and duration. A key contrast in their analysis concerned the auditory sequences composed of 4 “long” tones vs 12 “medium” tones or 4 "medium" tones vs 12 "short" tones. These pairs of sequences lasted the same length overall but obviously contained a different number of notes.

What did they find?

The authors found unique neural responses to different number conditions, demonstrating that three-month old infant brains can estimate the number of tones in an auditory sequence separately from other magnitudes. Further, infants were able to encode numbers even during sleep. This implies that number is a fundamental and critical dimension for representing the auditory environment around us.  

What's the impact?

These findings confirm that our brain treats number as a basic dimension of the environment from a very young age. As other researchers believe that the ability to process approximate numbers is the starting point for a deeper understanding of mathematics, these findings may have practical implications in educational and rehabilitative interventions.  

Overestimation of Moral Outrage in Twitter Users on Political Topics

Post by Lani Cupo

The takeaway

When people read posts on social media, they are likely to overestimate how much moral outrage the author of the post felt. Further, they are likely to attribute the same level of outrage to a larger group, misperceiving the extent of collective moral outrage.

What's the science?

For a democracy to function, citizens must be able to assess collective moral attitudes, accurately identifying common ground among citizens and understanding what topics are most important to the members of opposing political parties. The use of social media platforms for political conversations can warp and skew social perceptions about the values and opinions of others. It is still unclear how social media, in its current form, might distort perceived outrage among politically-partisan users. This week in Nature, Brady and colleagues examine perceptions of Twitter posts (tweets) to understand how accurately readers can assess moral outrage in the original tweet’s author.

How did they do it?

The authors first conducted a field study using Twitter as a naturalistic study environment. They employed a machine learning algorithm to identify users who often posted high or low levels of outrage while discussing topics in American politics. Then, within 15 minutes of them posting a tweet, the authors invited them to take a survey about how happy or outraged they were while writing the tweet. Then, the authors recruited a separate group of politically-partisan Twitter users to read the tweets and judge how happy or outraged they thought the tweet author was when they wrote the message. In a follow-up study, the authors examined whether overestimating outrage in an individual amplifies the perception of collective moral outrage (i.e. overestimating the outrage of an entire group). To do so, they created two mock Twitter feeds with the tweets from the first experiment that both contained the same amount of outraged tweets based on how the tweet-author rated them, but one feed contained more tweets that were overestimated for outrage (high-overperception feed) and one contained tweets that were not overestimated (low-overperception feed). After exposing different groups of participants to these feeds, they assessed whether they perceived collective outrage to be greater. In a final follow-up study, a new set of participants was shown one of the mock Twitter feeds (either high- or low-overperception) and then asked to assess ten political tweets that contained opinions with either outraged or neutral language. The participants were asked to judge how appropriate the tweet would be in the network they observed, how much they thought the social network they observed liked the opposite political group, and how extreme the network was.

What did they find?

First, the authors found that readers overestimated how outraged the author of the tweet was. Importantly, their ratings correlated with those of the tweet-author (if the tweet-author was slightly outraged, the reader perceived them as outraged), but the reader overestimated the amount of outrage nevertheless. The readers who spent more time on social media to learn about politics were more likely to overestimate outrage, regardless of how politically extreme they were themselves or how strongly they aligned with a political group. Second, in the follow-up experiment, the authors found participants in the high-overperception feed were more likely to judge the collective outrage of their social network as high than those in the low-overperception feed, suggesting that overestimation of social outrage increases the perception of collective outrage. Finally, the authors found the high-overperception network was assessed to be more politically extreme and to dislike their political opponents more. It was also deemed socially acceptable to post tweets with more outrage, showing that overperception of collective outrage altered the perception of social norms in a group.

What's the impact?

This study provides evidence that moral outrage on political topics is overestimated on social media platforms, and this overperception can alter societal expectations in the network. These results provide a foundation to understand how social media may distort social knowledge, especially on controversial political opinions. In time, they may form the basis for countering political antipathy that is amplified on social media platforms.